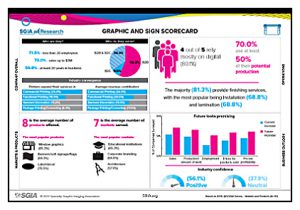
Convergence, where print service providers (PSPs) offer services and products beyond their traditional scope, showed up significantly in the Specialty Graphic Imaging Association’s (SGIA) Quarterly Industry Benchmarking Report, which focused on markets and products.
In each of the printing industry segments investigated (graphic and sign producers, apparel decorators, functional printers, and commercial printers), survey data showed, to varying degrees, companies do not restrict themselves to their primary segments. The proportion of printers who identified as serving at least two industry segments ranged from 31.9 percent (apparel decorators) to 63.3 percent (commercial printers). According to the data, additional segments may bring in more than one-quarter of revenue, on average, as seen with graphic and sign producers, for whom commercial printing contributed 26.9 percent of revenue.
Going deeper into the convergence subject, the studies look at the products and markets printers currently serve, their growth potential and desirability. From the operational side, printing technologies used, capacity utilization and value-added services provided to customers and exchanged between printers themselves are also discussed in the reports.
“We ask the printers what they do, how they do it and what the outcomes—such as sales, production, employment, product pricing, and profitability—are,” said Olga Dorokhina, Research Coordinator, SGIA. “Comparing their current business indicators with their expectations allows us to learn about their goals. Our next series of quarterly reports will explore how they plan to achieve their goals.”
Reports of rising sales exceed reports of rising profitability in every segment studied, prompting SGIA Chief Economist Andy Paparozzi to ask why. “The results we got in the first quarter verify that we need to look at what happens between the top line and the bottom line,” he said. “That’s the point of our quarterly research.”
The second quarter convergence research currently underway focuses on financial ratios. Other surveys planned for 2019 are on wage, salary, and sales compensation (Q3), and growth strategies and capital investments (Q4). Each survey includes input from panels of PSPs, suppliers, and manufacturers, with questionnaires supplemented by interviews.
“The interviews help us connect the dots to find out why companies are excelling,” Paparozzi added.
To add context to the benchmarking reports, SGIA also publishes a quarterly “SGIA Economy Watch,” which provides a concise overview of the U.S. economy.
SGIA Quarterly Industry Benchmarking Reports are available at SGIA.org/resources/research. Infographics summarizing each market segment’s results can be downloaded by the public; full reports are available to SGIA members only.


