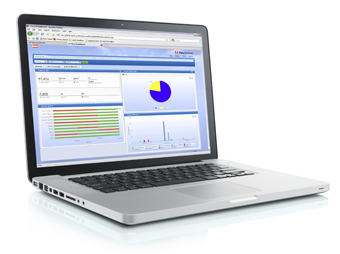
 With the thirteenth annual Connect users’ conference underway, EFI™ (Nasdaq: EFII) launched Fiery® Dashboard, a cloud-based service that enables owners and production managers to easily and quickly analyze their operations and make better business decisions. Fiery Dashboard provides 24/7 access to real-time production data from any Internet browser, including mobile phones and tablets. Connect attendees can see Fiery Dashboard in the solutions lab through April 13 at the Wynn; a thirty-day free trial is available now, as well as a video demo.
“From printer uptime and utilization to media use and paper jams, as well as a host of other metrics, now print shop owners and managers can take better control of their operation with our cloud-based Fiery Dashboard service,” said John Henze, vice president of Fiery marketing at EFI. “Users don’t have to be in their shop to stay on top of their operations, and don’t need to stop the presses to get the information necessary to make the right, data-driven business decisions.”
“As the general manager at University Graphic Systems, California Polytechnic State University’s print shop, Fiery Dashboard has helped keep me on top of what’s happening on the production floor and drill down into the reasons, without even having to be at the shop,” said David Messer. “This service provides excellent graphical displays, which in turn have allowed our digital press operators to better understand how reducing waste and downtime positively affects our bottom line.”
With Fiery Dashboard, managers can collect a vast amount of production-level data to monitor and measure what is most important to them. The dashboard view can be customized to focus on specific printers or groups of printers, define targets for engine utilization, or choose different date ranges to measure daily, weekly, quarterly or even annual growth. Managers can easily see engine utilization and status, jobs and pages printed by media and the split between color and black and white. There are also a range of metrics that identify the source of production inefficiencies, from job errors and cancellations to paper jams.
Fiery Dashboard also presents system status such as when engines need calibration to ensure color consistency in addition to identifying current level of software updates.
Owners and managers can compare these metrics between any or all Fiery Driven™ printers in the shop to understand relative engine productivity to more efficiently leverage resources across the shop. For instance, an owner may want to track black & white pages printed on a color device to help determine if it makes more sense to purchase a dedicated black & white printer. Another example enables managers to compare printer utilization to help balance workload and optimize time shifts and schedules.
Fiery Dashboard is available now in English, French, Italian, German, and Spanish. A thirty-day free trial is available now in the U.S. and Canada. To purchase, call 800/875-7117 or contact EFI at [email protected].


